red virus depth of field background copy space text overlay corona coronavirus corona virus disease t20 omwLB8

10.19.21

COVID-19 Update | October 19, 2021

Actions

Type

COVID-19 Update

Topic

  • COVID-19
  • Disease Management

Tags

coronavirus COVID-19

This report from the Missouri Hospital Association is designed to help you stay abreast of recent developments related to COVID-19.

Share our online form with individuals interested in receiving this update.

Past issues are available in the Media Library.

Dashboard Spotlight

Key COVID-19 Metrics Reveal Encouraging Trend In Missouri, Local Variation Concerning

Staff Contact: Mat Reidhead or Jackie Gatz

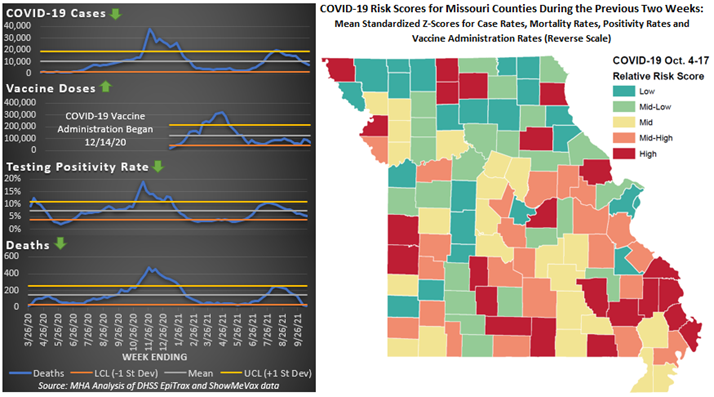
The fourth COVID-19 surge brought the national spotlight on the pernicious effects of the Delta variant to Missouri in late summer 2021. During that period, COVID-19 activity in the state — as measured by new cases, testing positivity rates and deaths — approached statistical thresholds not surpassed since the prolonged surge the state experienced during the late fall and winter of 2020-2021. Since the last week in September, new COVID-19 cases, testing positivity rates and deaths in Missouri each have fallen below the weekly average levels experienced statewide since the beginning of the pandemic in March 2020. Unfortunately, the weekly number of COVID-19 vaccine doses administered in Missouri has remained below average since late May 2021.

While the overall levels of community transmission in Missouri continue to recede, there are several counties throughout the state experiencing continued elevated levels.

  • Sullivan County in north central Missouri had the highest estimated risk during the previous two weeks with 17% of tests returning a positive result (compared with 5.5% statewide), 16.4 COVID-19 deaths per 100,000 (versus 0.59 statewide), 394 new cases per 100,000 (versus 215 statewide) and only 920 vaccine doses administered per 100,000 residents (versus 2,443 statewide).
  • Mercer County, which adjoins Sullivan County to the northwest, experienced the highest testing positivity rate over the previous two weeks at 18.9%.
  • Atchison County in the far northwest corner of the state had the highest rate of new COVID-19 cases over the previous two weeks at 525 per 100,000 residents.
  • COVID-19 vaccine doses administered during the previous two weeks ranged from 468 per 100,000 residents in Putnam County to 7,179 in Jackson County, a difference of 15-fold.
Government Action
Vaccine Updates
Data & Analytics
Noteworthy
Back to Top